Overview of the NEM-Review Analysis Client
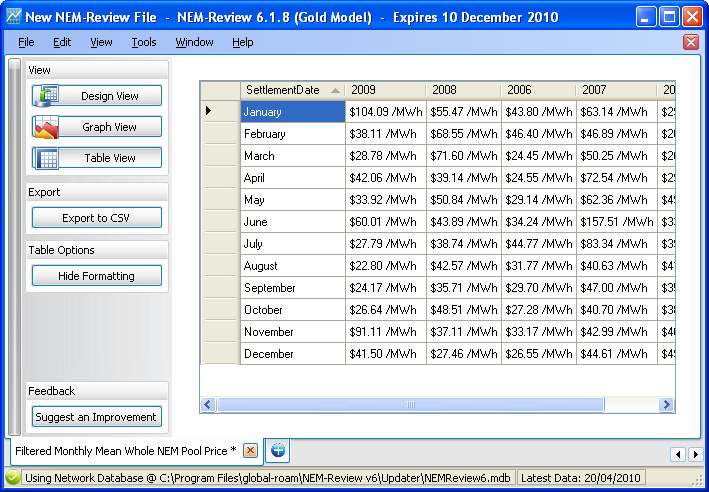
When you first open the NEM-Review Analysis Client you will see this screen:
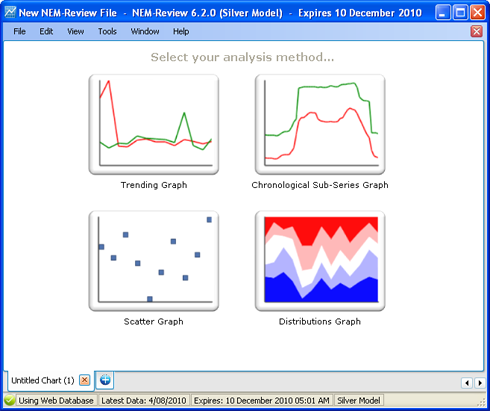
Four Modes of Analysis
The four buttons in the center of the screen allow you to start analysing data in one of the available analysis modes.
Trending Graph
Select any number of data sets to graph over a single time range (e.g. trend QLD pool price and demand over the last week).
How to create a trending graph.
Chronological Subseries Graph
Compare the trend in a single data set over multiple time periods (e.g. compare the monthly average QLD pool price for 2007, 2008 and 2009).
How to create a chronological subseries graph.
Scatter Graph
Plot two data sets against each other to see their relationship (e.g. plot price against demand).
How to create a scatter graph.
Distribution Graph
Show how the values of a single data set are distributed over several value bands, and how this changes over time.
How to create a distribution graph.
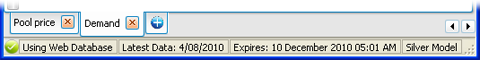
Tabs
Along the bottom of the screen are tabs. Each tab contains a single graph (like sheets in an Excel file). Creating a new tab creates a new graph.
You can create a new tab by clicking the blue +, or close a tab by clicking the red x.
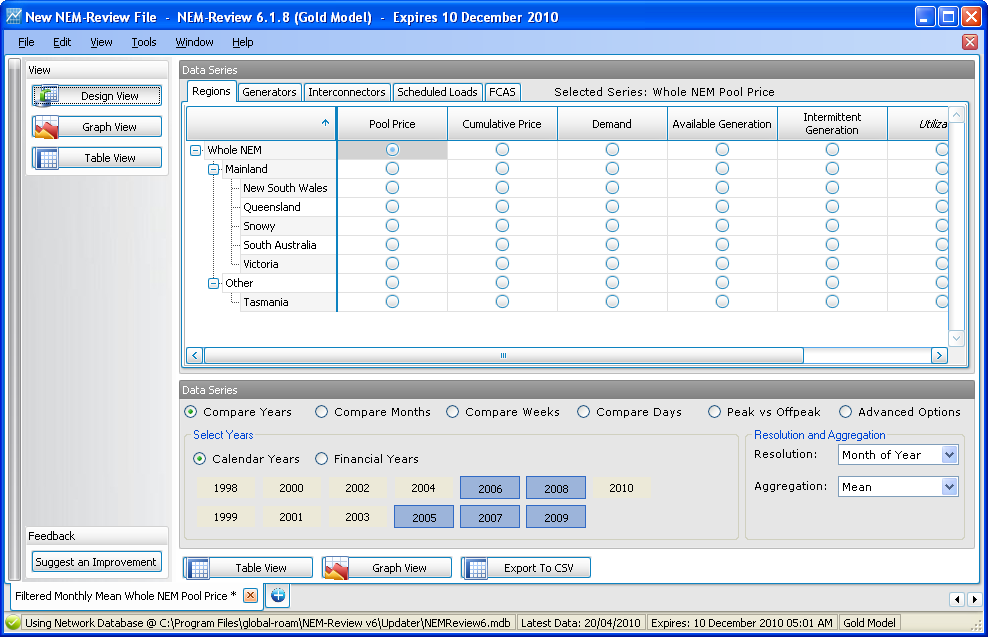
Views
On each tab you can switch between 3 different views of your analysis:
Design View
|
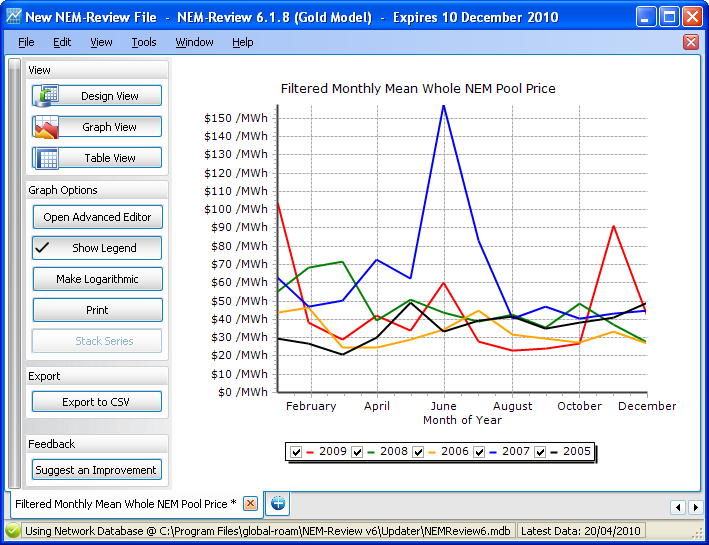
Graph View
|
Table View
|
Switching Between Views
To change between the different views you can use the View menu (in the menu bar), or the Design View, Graph View and Table View buttons:
They can be found at the bottom of the Design View screen, or in the side menu.
Save to a File
You can save your current set of tabs to a .nrf file to open again later or share with others. See Saving and Sharing for more details.
Generator Catalogue
Included in the Analysis Client is a generator catalogue. This lists factors and general information about generator units and stations such as fuel type, owner, auxilliary factors, emissions factors and more.
Find out more about how to use the generator catalogue here.
NEM-Reports Manager
Also from within the Analysis Client, you can use the NEM-Reports manager to set up regular reports to be emailed to people in your organisation. NEM-Reports summarise recent NEM-data into pdf reports emailed to you weekly or monthly.
Find out more about NEM-Reports.